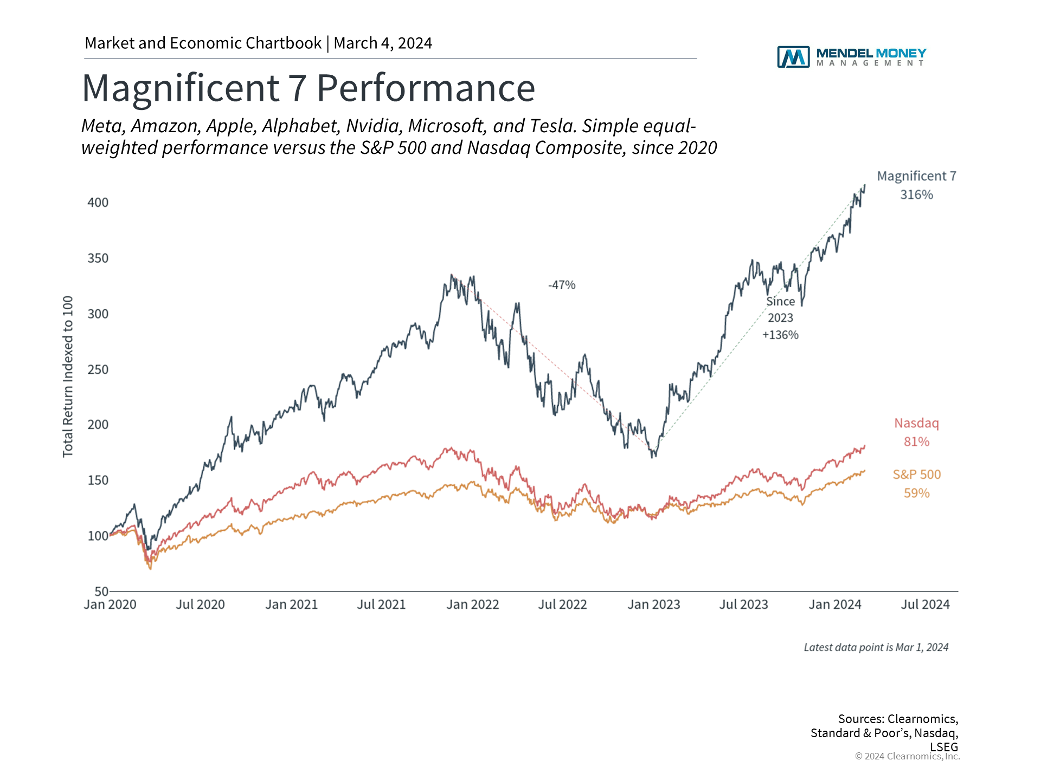
The stock market continues to reach new heights, driven by a stronger-than-expected economy and the largest technology stocks. In particular, Nvidia, a maker of graphics chips used in artificial intelligence applications, recently helped to push markets higher after it beat Wall Street earnings expectations. This has added to the gains made by the group known as the Magnificent Seven which consists of fast-growing technology companies, many of which have market capitalizations of a trillion dollars or more. In this environment, some investors may be nervous that the market has risen so far, so fast. At the same time, other investors may have a growing fear that they are missing out. How can long-term investors stay balanced when markets have climbed so quickly?
Large technology stocks have propelled the market
Perhaps the most important consequence of the bull market rally of the past year is that valuation levels are no longer as attractive. The S&P 500 has gained about 28% during this time while the Nasdaq and Dow Jones Industrial Average have risen 40% and 19%, respectively. As a result, the price-to-earnings (P/E) ratio for the S&P 500 is now 20.4, meaning that investors are willing to pay $20.40 for every dollar of expected earnings. While this is below both its peak before the 2022 bear market as well as the historic high during the dot-com bubble, it is still well above its long-run average of 15.6. Not surprisingly, the P/E ratio of the Information Technology sector of the S&P 500 is one of the loftiest at 28.1.
Why are valuations important to long-term investors? Simply put, valuations are among the best tools that investors have to gauge the attractiveness of the stock market over years and decades. Unlike stock prices on their own, valuations don’t just tell you how much something costs, but what you get for your money. After all, holding shares of a company means you are entitled to a portion of its value which ideally grows over time. Valuations are correlated with long-term portfolio returns for this reason – buying when the market is cheap can improve the chances of success and buying when the market is relatively expensive can be a drag on future returns.
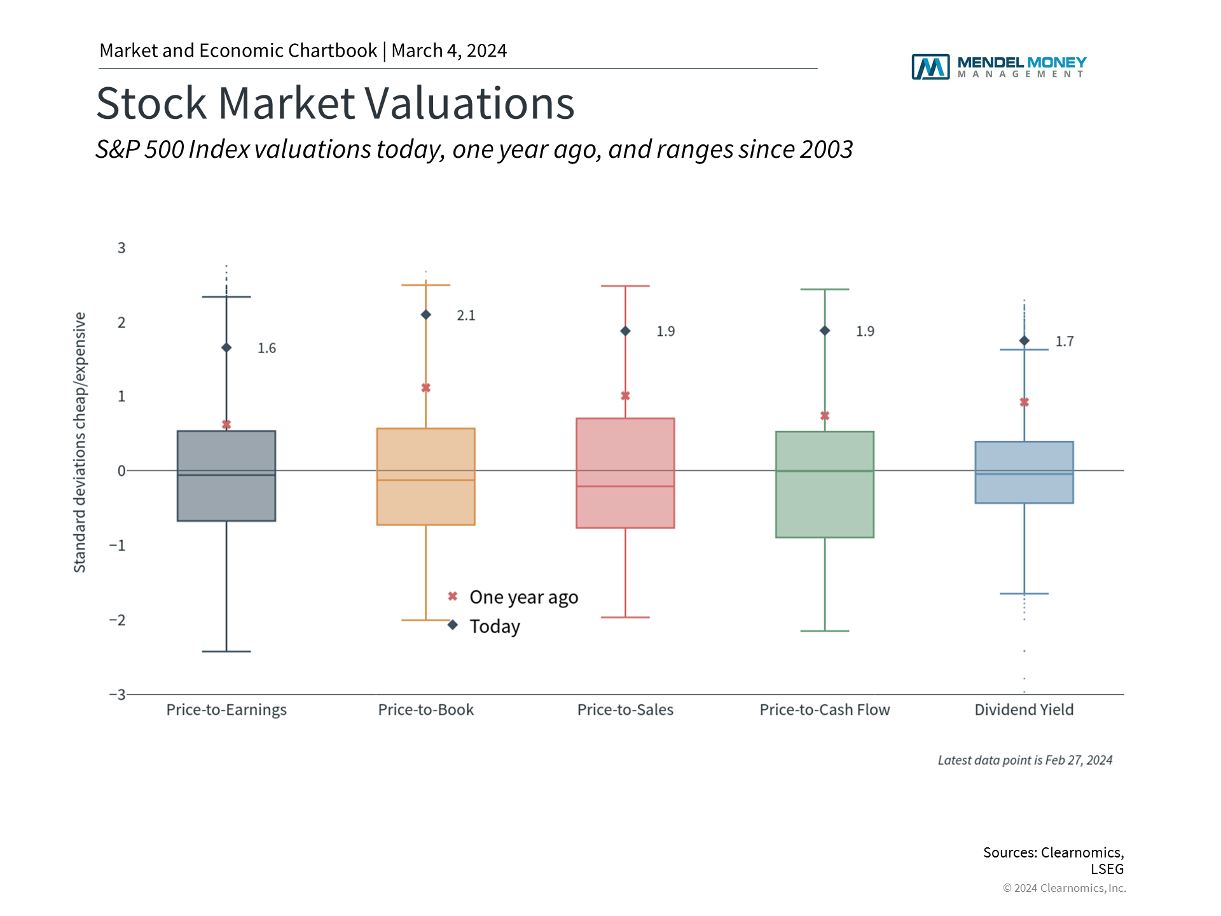
However, valuations are neither market timing tools nor do they explain all market movements. Instead, they are simply guideposts that can help investors determine appropriate asset allocations based on their financial goals. As the accompanying chart shows, most valuation measures are now well above their long run averages including price-to-book, price-to-sales, dividend yield, and more. This is partly because the underlying fundamentals are still catching up with the market rally. As sales grow, earnings improve, and interest rates stabilize, valuations could begin to improve as well. Thus, higher valuations are not a reason to avoid stocks but are instead a reminder to focus on diversifying both within the stock market as well as across asset classes.
Valuations have increased over the past year
Case in point: the rally in mega cap technology stocks is an important reason to be diversified across a variety of sectors. Not only do diversified investors benefit from the returns experienced by the Magnificent Seven and the technology sector more broadly, but they also protect their portfolios from downside risk and position themselves to take advantage of growth in other parts of the market. As all investors know, past performance is no guarantee of future returns. Investors with long time horizons ought to remain balanced across a variety of sectors and styles that are tied to trends in the underlying economy.
Beyond today’s valuations and returns, another concern that some investors have is that a small group of companies is having an outsized impact on the overall stock market. Perhaps the simplest way to see this is to compare the standard S&P 500 index, which places a weight on each stock based on its size, to one which gives an equal weight to each stock. Both weighting methods are useful in different ways: using market cap weights provides a more accurate sense of the composition of the stock market – i.e., where the dollars are. Using equal weights helps investors to benefit from a broader base of companies to naturally diversify.
Historically, stocks of all sizes have contributed to market returns
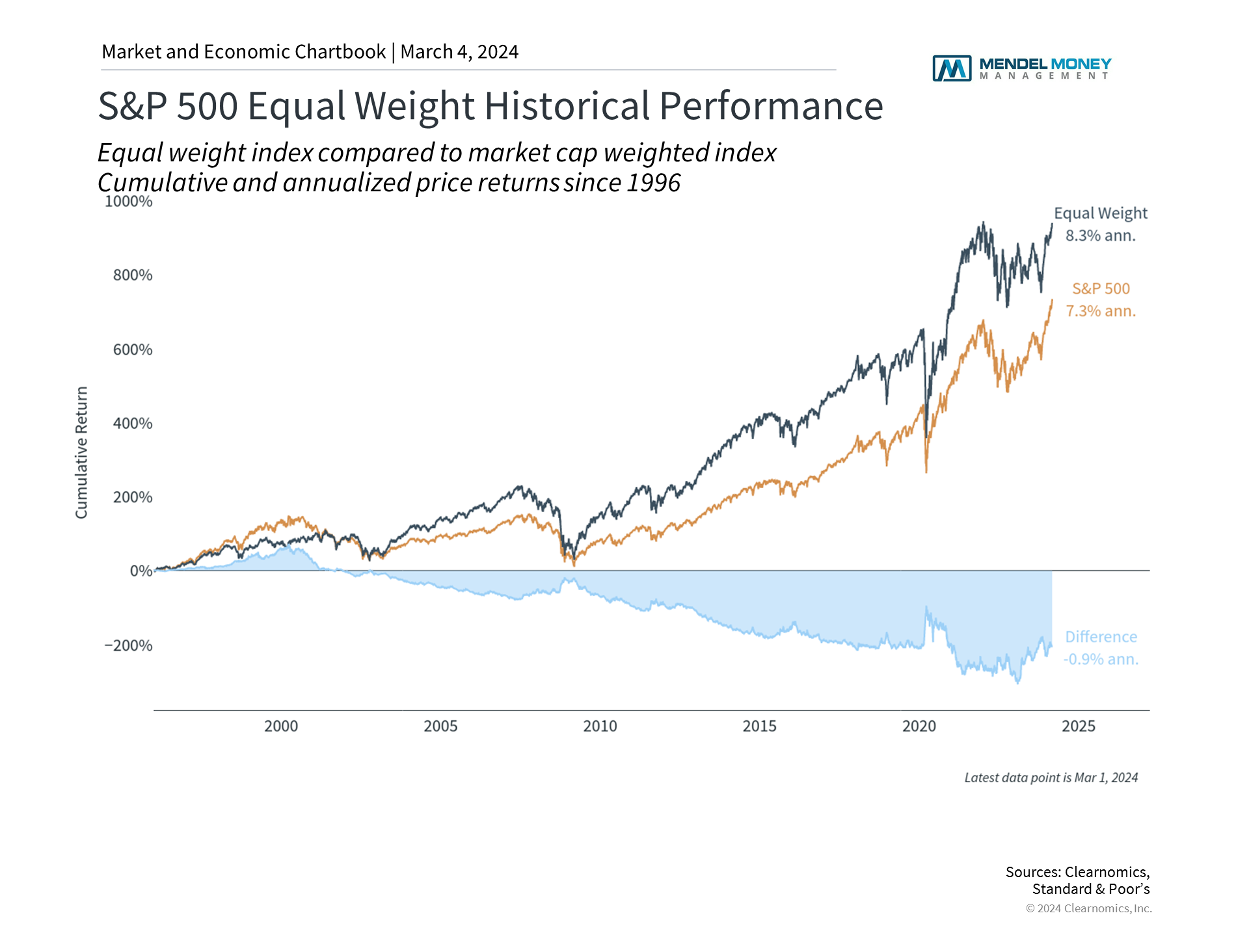
As the accompanying chart shows, it’s not the case that large companies have always dominated stock market returns. For much of the history of the stock market, the largest companies were often seen as the most boring (e.g. “blue chips”) and primarily served as a source of stable dividends. Over the past 15 years, the equal weight S&P 500 index has actually outperformed the market cap-weighted index since it benefits from returns across a wider array of stocks. Although the largest companies have outperformed in recent years, taking a longer perspective paints a different picture. It’s important for investors to keep this in mind as they make portfolio decisions.
The bottom line? With the market near all-time highs and seemingly driven by a small group of stocks, investors ought to focus more on valuations and staying diversified. History shows that doing so can help investors to achieve their long-term financial goals regardless of market conditions.
Copyright (c) 2024 Clearnomics, Inc. All rights reserved. The information contained herein has been obtained from sources believed to be reliable, but is not necessarily complete and its accuracy cannot be guaranteed. No representation or warranty, express or implied, is made as to the fairness, accuracy, completeness, or correctness of the information and opinions contained herein. The views and the other information provided are subject to change without notice. All reports posted on or via www.clearnomics.com or any affiliated websites, applications, or services are issued without regard to the specific investment objectives, financial situation, or particular needs of any specific recipient and are not to be construed as a solicitation or an offer to buy or sell any securities or related financial instruments. Past performance is not necessarily a guide to future results. Company fundamentals and earnings may be mentioned occasionally, but should not be construed as a recommendation to buy, sell, or hold the company’s stock. Predictions, forecasts, and estimates for any and all markets should not be construed as recommendations to buy, sell, or hold any security–including mutual funds, futures contracts, and exchange traded funds, or any similar instruments. The text, images, and other materials contained or displayed in this report are proprietary to Clearnomics, Inc. and constitute valuable intellectual property. All unauthorized reproduction or other use of material from Clearnomics, Inc. shall be deemed willful infringement(s) of this copyright and other proprietary and intellectual property rights, including but not limited to, rights of privacy. Clearnomics, Inc. expressly reserves all rights in connection with its intellectual property, including without limitation the right to block the transfer of its products and services and/or to track usage thereof, through electronic tracking technology, and all other lawful means, now known or hereafter devised. Clearnomics, Inc. reserves the right, without further notice, to pursue to the fullest extent allowed by the law any and all criminal and civil remedies for the violation of its rights.
This presentation is not an offer or a solicitation to buy or sell securities. The information contained in this presentation has been compiled from third party sources and is believed to be reliable; however, its accuracy is not guaranteed and should not be relied upon in any way, whatsoever. This presentation may not be construed as investment advice and does not give investment recommendations. Any opinion included in this report constitutes our judgment as of the date of this report and are subject to change without notice.
Additional information, including management fees and expenses, is provided on our Form ADV Part 2, available upon request or at the SEC’s Investment Advisor Public Disclosure site. As with any investment strategy, there is potential for profit as well as the possibility of loss. We do not guarantee any minimum level of investment performance or the success of any portfolio or investment strategy. All investments involve risk (the amount of which may vary significantly) and investment recommendations will not always be profitable. Past performance is not a guarantee of future results.